Cattle Egret
Bubulcus ibis
ABR description
The following is extracted from the Annual Bird Report for the twelve months to June 2017.
Uncommon, non-breeding visitor
Occasionally seen in grassy surrounds of bodies of water, sometimes in flocks of up to 30.
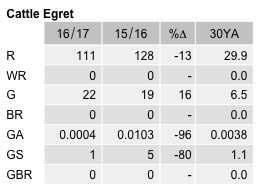
General: Both the abundance and reporting rates for this species have declined slightly over the past 3 years, with the reporting rate (0.8%) being slightly below last year and the 10 & 30YA (1.1%). Most records were from JWNR/FSP (70) with a few from other Canberra wetlands and sites in NSW. Max 83/29 Oct JWNR (W S1), mean 7.1 and median 3. Most records in spring (46%) and autumn (37%) with the lowest in winter (6%). Like last year there were probably 2 large flocks reported at JWNR in Oct/Nov and again in late Mar/Apr.
GBS: 1 record only from Curtin 2wk Apr (AjR1).
Abundance
Abundance is the average number of birds of that species per survey. Where the species was observed (presence recorded) but the number of birds seen was not recorded, this is treated as a count of zero.
Abundance by year
This chart shows the abundance of Cattle Egret between 1982 and 2017. 
Abundance by month
This chart shows the monthly abundance of Cattle Egret. The blue lines show the abundance for the twelve months to June 2017 and the bars show the average abundance for the period 1982 to 2017. 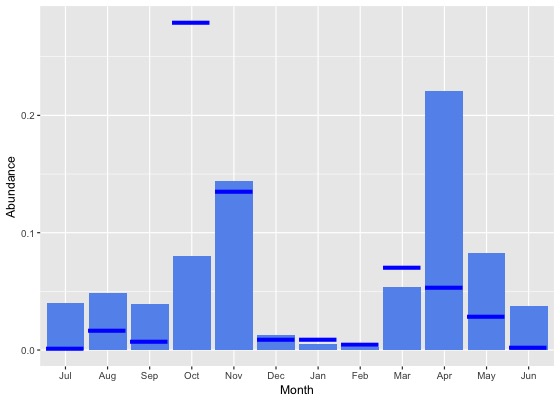
Abundance by season
This chart shows the seasonal abundance of Cattle Egret. The blue lines show the seasonal abundance for the twelve months to June 2017 and the bars show the average seasonal abundance for the period 1982 to 2017. 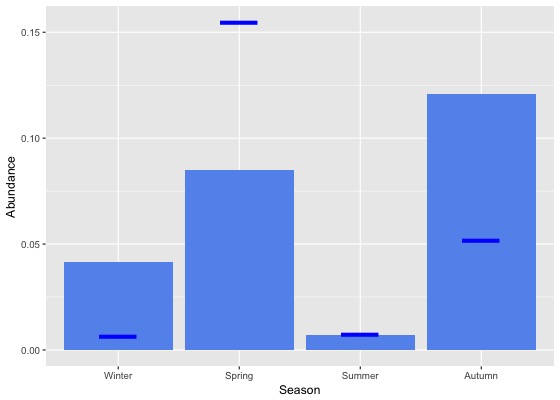
Abundance data
| Month | Season | ||||||||||||||||||
|---|---|---|---|---|---|---|---|---|---|---|---|---|---|---|---|---|---|---|---|
| Period | Jul | Aug | Sep | Oct | Nov | Dec | Jan | Feb | Mar | Apr | May | Jun | Winter | Spring | Summer | Autumn | All | ||
| All years | |||||||||||||||||||
| All | 0.0 | 0.0 | 0.0 | 0.1 | 0.1 | 0.0 | 0.0 | 0.0 | 0.1 | 0.2 | 0.1 | 0.0 | 0.0 | 0.1 | 0.0 | 0.1 | 0.1 | ||
| Previous years | |||||||||||||||||||
| All previous years | 0.0 | 0.1 | 0.0 | 0.1 | 0.1 | 0.0 | 0.0 | 0.0 | 0.1 | 0.2 | 0.1 | 0.0 | 0.0 | 0.1 | 0.0 | 0.1 | 0.1 | ||
| Previous 30 years | 0.0 | 0.1 | 0.0 | 0.1 | 0.1 | 0.0 | 0.0 | 0.0 | 0.1 | 0.2 | 0.1 | 0.0 | 0.0 | 0.1 | 0.0 | 0.1 | 0.1 | ||
| Previous 20 years | 0.0 | 0.0 | 0.0 | 0.0 | 0.2 | 0.0 | 0.0 | 0.0 | 0.1 | 0.3 | 0.1 | 0.0 | 0.0 | 0.1 | 0.0 | 0.1 | 0.1 | ||
| 10 year groups | |||||||||||||||||||
| [2007,2017) | 0.0 | 0.1 | 0.0 | 0.0 | 0.3 | 0.0 | 0.0 | 0.0 | 0.1 | 0.3 | 0.1 | 0.0 | 0.0 | 0.1 | 0.0 | 0.2 | 0.1 | ||
| [1997,2007) | 0.0 | 0.0 | 0.0 | 0.0 | 0.0 | 0.0 | 0.0 | 0.0 | 0.0 | 0.1 | 0.0 | 0.0 | 0.0 | 0.0 | 0.0 | 0.0 | 0.0 | ||
| [1987,1997) | 0.1 | 0.1 | 0.2 | 0.2 | 0.0 | 0.0 | 0.0 | 0.0 | 0.0 | 0.1 | 0.1 | 0.1 | 0.1 | 0.1 | 0.0 | 0.1 | 0.1 | ||
| 5 year groups | |||||||||||||||||||
| [2012,2017) | 0.1 | 0.1 | 0.0 | 0.1 | 0.3 | 0.0 | 0.0 | 0.0 | 0.1 | 0.5 | 0.2 | 0.0 | 0.1 | 0.1 | 0.0 | 0.2 | 0.1 | ||
| [2007,2012) | 0.0 | 0.0 | 0.0 | 0.0 | 0.1 | 0.0 | 0.0 | 0.0 | 0.0 | 0.1 | 0.0 | 0.0 | 0.0 | 0.0 | 0.0 | 0.1 | 0.0 | ||
| [2002,2007) | 0.0 | 0.0 | 0.0 | 0.0 | 0.0 | 0.0 | 0.0 | 0.0 | 0.0 | 0.1 | 0.0 | 0.0 | 0.0 | 0.0 | 0.0 | 0.0 | 0.0 | ||
| [1997,2002) | 0.0 | 0.0 | 0.0 | 0.0 | 0.0 | 0.0 | 0.0 | 0.0 | 0.0 | 0.0 | 0.0 | 0.0 | 0.0 | 0.0 | 0.0 | 0.0 | 0.0 | ||
| [1992,1997) | 0.2 | 0.2 | 0.4 | 0.3 | 0.1 | 0.0 | 0.0 | 0.0 | 0.1 | 0.2 | 0.1 | 0.1 | 0.2 | 0.2 | 0.0 | 0.1 | 0.1 | ||
| [1987,1992) | 0.1 | 0.1 | 0.1 | 0.1 | 0.0 | 0.0 | 0.0 | 0.0 | 0.0 | 0.1 | 0.1 | 0.2 | 0.1 | 0.1 | 0.0 | 0.1 | 0.1 | ||
| Year | |||||||||||||||||||
| 2017 | 0.0 | 0.0 | 0.0 | 0.3 | 0.1 | 0.0 | 0.0 | 0.0 | 0.1 | 0.1 | 0.0 | 0.0 | 0.0 | 0.2 | 0.0 | 0.1 | 0.1 | ||
| 2016 | 0.0 | 0.0 | 0.0 | 0.1 | 0.4 | 0.0 | 0.0 | 0.0 | 0.0 | 0.1 | 0.1 | 0.0 | 0.0 | 0.1 | 0.0 | 0.1 | 0.1 | ||
| 2015 | 0.2 | 0.2 | 0.1 | 0.1 | 0.2 | 0.0 | 0.0 | 0.0 | 0.0 | 0.2 | 0.2 | 0.0 | 0.1 | 0.1 | 0.0 | 0.1 | 0.1 | ||
| 2014 | 0.0 | 0.0 | 0.0 | 0.0 | 0.0 | 0.0 | 0.0 | 0.0 | 0.3 | 1.7 | 0.3 | 0.1 | 0.1 | 0.0 | 0.0 | 0.8 | 0.2 | ||
| 2013 | 0.0 | 0.0 | 0.0 | 0.0 | 0.3 | 0.1 | 0.0 | 0.0 | 0.0 | 0.3 | 0.2 | 0.0 | 0.0 | 0.1 | 0.0 | 0.2 | 0.1 | ||
| 2012 | 0.0 | 0.1 | 0.0 | 0.1 | 0.4 | 0.0 | 0.0 | 0.0 | 0.1 | 0.7 | 0.3 | 0.2 | 0.1 | 0.1 | 0.0 | 0.4 | 0.1 | ||
| 2011 | 0.0 | 0.0 | 0.0 | 0.0 | 0.0 | 0.0 | 0.0 | 0.0 | 0.0 | 0.0 | 0.0 | 0.0 | 0.0 | 0.0 | 0.0 | 0.0 | 0.0 | ||
| 2010 | 0.0 | 0.0 | 0.0 | 0.0 | 0.0 | 0.0 | 0.0 | 0.0 | 0.0 | 0.0 | 0.0 | 0.0 | 0.0 | 0.0 | 0.0 | 0.0 | 0.0 | ||
| 2009 | 0.0 | 0.0 | 0.0 | 0.0 | 0.0 | 0.0 | 0.0 | 0.0 | 0.2 | 0.0 | 0.0 | 0.0 | 0.0 | 0.0 | 0.0 | 0.1 | 0.0 | ||
| 2008 | 0.0 | 0.0 | 0.0 | 0.0 | 0.0 | 0.0 | 0.0 | 0.0 | 0.0 | 0.1 | 0.0 | 0.0 | 0.0 | 0.0 | 0.0 | 0.0 | 0.0 | ||
| 2007 | 0.0 | 0.0 | 0.0 | 0.0 | 0.6 | 0.0 | 0.0 | 0.0 | 0.0 | 0.3 | 0.1 | 0.0 | 0.0 | 0.1 | 0.0 | 0.1 | 0.1 | ||
| 2006 | 0.0 | 0.0 | 0.0 | 0.0 | 0.0 | 0.0 | 0.0 | 0.0 | 0.0 | 0.3 | 0.0 | 0.0 | 0.0 | 0.0 | 0.0 | 0.1 | 0.0 | ||
| 2005 | 0.0 | 0.0 | 0.0 | 0.0 | 0.0 | 0.0 | 0.0 | 0.0 | 0.0 | 0.0 | 0.0 | 0.0 | 0.0 | 0.0 | 0.0 | 0.0 | 0.0 | ||
| 2004 | 0.0 | 0.0 | 0.0 | 0.0 | 0.0 | 0.0 | 0.0 | 0.0 | 0.0 | 0.1 | 0.0 | 0.0 | 0.0 | 0.0 | 0.0 | 0.0 | 0.0 | ||
| 2003 | 0.0 | 0.0 | 0.0 | 0.0 | 0.1 | 0.0 | 0.0 | 0.0 | 0.0 | 0.0 | 0.0 | 0.0 | 0.0 | 0.0 | 0.0 | 0.0 | 0.0 | ||
| 2002 | 0.0 | 0.0 | 0.0 | 0.0 | 0.0 | 0.0 | 0.0 | 0.0 | 0.1 | 0.0 | 0.0 | 0.0 | 0.0 | 0.0 | 0.0 | 0.0 | 0.0 | ||
| 2001 | 0.0 | 0.0 | 0.0 | 0.0 | 0.0 | 0.0 | 0.0 | 0.0 | 0.0 | 0.0 | 0.0 | 0.0 | 0.0 | 0.0 | 0.0 | 0.0 | 0.0 | ||
| 2000 | 0.0 | 0.0 | 0.0 | 0.0 | 0.0 | 0.0 | 0.0 | 0.0 | 0.0 | 0.0 | 0.2 | 0.0 | 0.0 | 0.0 | 0.0 | 0.0 | 0.0 | ||
| 1999 | 0.0 | 0.0 | 0.0 | 0.0 | 0.0 | 0.0 | 0.0 | 0.0 | 0.0 | 0.0 | 0.0 | 0.0 | 0.0 | 0.0 | 0.0 | 0.0 | 0.0 | ||
| 1998 | 0.0 | 0.0 | 0.0 | 0.0 | 0.1 | 0.0 | 0.0 | 0.0 | 0.1 | 0.2 | 0.0 | 0.0 | 0.0 | 0.0 | 0.0 | 0.1 | 0.0 | ||
| 1997 | 0.0 | 0.1 | 0.0 | 0.0 | 0.0 | 0.0 | 0.0 | 0.0 | 0.3 | 0.0 | 0.0 | 0.0 | 0.0 | 0.0 | 0.0 | 0.1 | 0.0 | ||
| 1996 | 0.0 | 0.0 | 0.0 | 0.0 | 0.1 | 0.0 | 0.0 | 0.0 | 0.1 | 0.1 | 0.0 | 0.0 | 0.0 | 0.0 | 0.0 | 0.1 | 0.0 | ||
| 1995 | 0.0 | 0.0 | 0.0 | 0.4 | 0.0 | 0.0 | 0.0 | 0.0 | 0.1 | 0.0 | 0.0 | 0.0 | 0.0 | 0.2 | 0.0 | 0.0 | 0.1 | ||
| 1994 | 0.2 | 0.0 | 0.0 | 0.1 | 0.1 | 0.0 | 0.0 | 0.0 | 0.0 | 0.2 | 0.2 | 0.1 | 0.1 | 0.1 | 0.0 | 0.1 | 0.1 | ||
| 1993 | 0.2 | 0.2 | 0.1 | 0.2 | 0.0 | 0.0 | 0.0 | 0.0 | 0.1 | 0.8 | 0.0 | 0.0 | 0.1 | 0.1 | 0.0 | 0.3 | 0.1 | ||
| 1992 | 0.7 | 1.1 | 1.6 | 0.7 | 0.1 | 0.3 | 0.0 | 0.0 | 0.1 | 0.0 | 0.2 | 0.4 | 0.7 | 0.8 | 0.1 | 0.1 | 0.5 | ||
| 1991 | 0.3 | 0.2 | 0.9 | 0.3 | 0.4 | 0.0 | 0.1 | 0.0 | 0.0 | 0.1 | 0.4 | 0.8 | 0.4 | 0.5 | 0.0 | 0.2 | 0.3 | ||
| 1990 | 0.0 | 0.1 | 0.2 | 0.3 | 0.0 | 0.0 | 0.0 | 0.0 | 0.0 | 0.1 | 0.1 | 0.5 | 0.1 | 0.2 | 0.0 | 0.1 | 0.1 | ||
| 1989 | 0.0 | 0.0 | 0.0 | 0.2 | 0.0 | 0.0 | 0.0 | 0.0 | 0.0 | 0.1 | 0.1 | 0.0 | 0.0 | 0.1 | 0.0 | 0.1 | 0.0 | ||
| 1988 | 0.0 | 0.1 | 0.0 | 0.0 | 0.0 | 0.0 | 0.0 | 0.0 | 0.0 | 0.2 | 0.0 | 0.2 | 0.1 | 0.0 | 0.0 | 0.1 | 0.0 | ||
| 1987 | 0.0 | 0.0 | 0.0 | 0.0 | 0.0 | 0.0 | 0.0 | 0.0 | 0.0 | 0.0 | 0.0 | 0.0 | 0.0 | 0.0 | 0.0 | 0.0 | 0.0 | ||
| 1986 | 0.0 | 0.0 | 0.0 | 0.0 | 0.0 | 0.0 | 0.0 | 0.0 | 0.0 | 0.9 | 0.0 | 0.0 | 0.0 | 0.0 | 0.0 | 0.4 | 0.1 | ||
| 1985 | 0.0 | 0.0 | 0.0 | 0.0 | 0.0 | 0.0 | 0.0 | 0.0 | 0.0 | 1.3 | 0.0 | 0.0 | 0.0 | 0.0 | 0.0 | 0.6 | 0.1 | ||
| 1984 | 0.0 | 0.3 | 0.0 | 0.4 | 0.0 | 0.0 | 0.0 | 0.0 | 0.0 | 0.1 | 0.0 | 0.5 | 0.4 | 0.2 | 0.0 | 0.0 | 0.1 | ||
| 1983 | 0.0 | 0.2 | 0.0 | 0.2 | 0.0 | 0.0 | 0.0 | 0.0 | 0.0 | - | 0.2 | 0.0 | 0.1 | 0.1 | 0.0 | 0.1 | 0.1 | ||
| 1982 | - | 0.0 | - | 0.0 | 1.5 | 0.1 | - | 0.0 | - | 1.6 | - | 0.1 | 0.0 | 1.3 | 0.1 | 1.6 | 0.5 | ||
Reporting rates
Reporting rate is the proportion of all surveys in which the species was present.
Reporting rate by year
This chart shows the reporting rate of Cattle Egret each year between 1982 and 2017. 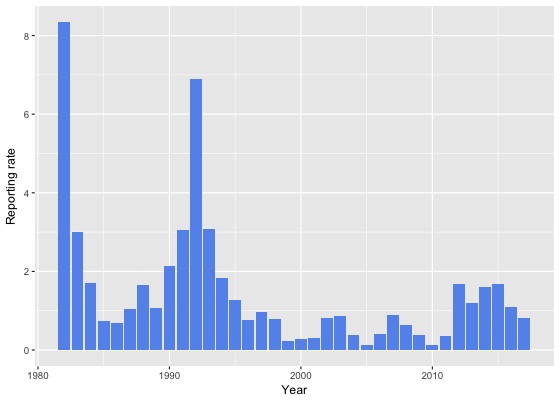
Reporting rate by month
This chart shows the reporting rate by month of Cattle Egret. The blue lines show the reporting rate for the twelve months to June 2017 and the bars show the average reporting rate for the period 1982 to 2017. 
Reporting rate by season
This chart shows the seasonal reporting rate of Cattle Egret. The blue lines show the seasonal reporting rate for the twelve months to June 2017 and the bars show the average seasonal reporting rate for the period 1982 to 2017. 
Reporting rate data
| Month | Season | ||||||||||||||||||
|---|---|---|---|---|---|---|---|---|---|---|---|---|---|---|---|---|---|---|---|
| Period | Jul | Aug | Sep | Oct | Nov | Dec | Jan | Feb | Mar | Apr | May | Jun | Winter | Spring | Summer | Autumn | All | ||
| All years | |||||||||||||||||||
| All | 1.1 | 1.2 | 0.9 | 1.3 | 1.8 | 0.4 | 0.4 | 0.2 | 1.1 | 2.0 | 1.7 | 0.7 | 1.0 | 1.3 | 0.3 | 1.6 | 1.1 | ||
| Previous years | |||||||||||||||||||
| All previous years | 1.2 | 1.3 | 1.0 | 1.2 | 1.7 | 0.5 | 0.3 | 0.2 | 1.1 | 2.2 | 1.9 | 0.8 | 1.1 | 1.3 | 0.3 | 1.7 | 1.1 | ||
| Previous 30 years | 1.2 | 1.3 | 1.0 | 1.2 | 1.7 | 0.5 | 0.3 | 0.2 | 1.1 | 2.1 | 1.9 | 0.8 | 1.1 | 1.3 | 0.3 | 1.7 | 1.1 | ||
| Previous 20 years | 0.9 | 1.2 | 0.6 | 1.0 | 1.9 | 0.4 | 0.3 | 0.2 | 1.0 | 1.8 | 2.0 | 0.5 | 0.8 | 1.1 | 0.3 | 1.5 | 0.9 | ||
| 10 year groups | |||||||||||||||||||
| [2007,2017) | 1.3 | 1.5 | 0.8 | 1.0 | 2.6 | 0.4 | 0.4 | 0.2 | 1.1 | 2.1 | 2.4 | 0.7 | 1.1 | 1.3 | 0.3 | 1.8 | 1.1 | ||
| [1997,2007) | 0.4 | 0.3 | 0.3 | 1.0 | 0.5 | 0.3 | 0.1 | 0.1 | 0.6 | 0.9 | 0.9 | 0.1 | 0.3 | 0.6 | 0.2 | 0.8 | 0.5 | ||
| [1987,1997) | 2.3 | 1.7 | 2.9 | 2.5 | 1.3 | 1.1 | 0.5 | 0.2 | 1.7 | 3.7 | 1.7 | 2.5 | 2.2 | 2.1 | 0.6 | 2.4 | 1.9 | ||
| 5 year groups | |||||||||||||||||||
| [2012,2017) | 1.6 | 2.0 | 1.1 | 1.4 | 2.9 | 0.5 | 0.5 | 0.3 | 1.3 | 2.6 | 2.7 | 1.0 | 1.5 | 1.7 | 0.4 | 2.1 | 1.4 | ||
| [2007,2012) | 0.2 | 0.0 | 0.0 | 0.4 | 1.7 | 0.2 | 0.0 | 0.0 | 0.8 | 1.0 | 1.5 | 0.1 | 0.1 | 0.5 | 0.1 | 1.1 | 0.5 | ||
| [2002,2007) | 0.2 | 0.2 | 0.4 | 1.3 | 0.6 | 0.4 | 0.1 | 0.0 | 0.5 | 1.1 | 0.9 | 0.2 | 0.2 | 0.8 | 0.2 | 0.8 | 0.5 | ||
| [1997,2002) | 0.6 | 0.6 | 0.2 | 0.5 | 0.4 | 0.2 | 0.0 | 0.2 | 0.8 | 0.6 | 0.9 | 0.0 | 0.3 | 0.4 | 0.1 | 0.8 | 0.4 | ||
| [1992,1997) | 3.4 | 2.8 | 5.9 | 3.6 | 1.6 | 1.2 | 0.8 | 0.0 | 2.5 | 3.2 | 0.8 | 3.0 | 3.0 | 3.5 | 0.7 | 2.2 | 2.5 | ||
| [1987,1992) | 1.8 | 1.1 | 1.4 | 1.8 | 1.1 | 1.0 | 0.4 | 0.3 | 1.2 | 4.0 | 2.1 | 2.3 | 1.7 | 1.4 | 0.6 | 2.5 | 1.5 | ||
| Year | |||||||||||||||||||
| 2017 | 0.1 | 0.4 | 0.4 | 1.8 | 2.1 | 0.3 | 0.5 | 0.2 | 1.2 | 1.1 | 1.0 | 0.2 | 0.2 | 1.5 | 0.3 | 1.1 | 0.8 | ||
| 2016 | 0.9 | 1.1 | 1.3 | 1.6 | 3.2 | 0.5 | 0.3 | 0.1 | 0.4 | 1.6 | 2.0 | 0.7 | 0.9 | 1.9 | 0.3 | 1.3 | 1.1 | ||
| 2015 | 4.4 | 5.6 | 2.3 | 1.4 | 2.6 | 0.4 | 0.2 | 0.3 | 0.5 | 2.7 | 2.5 | 0.4 | 2.9 | 2.0 | 0.3 | 1.8 | 1.7 | ||
| 2014 | 0.0 | 0.4 | 0.5 | 0.6 | 1.1 | 0.0 | 0.3 | 1.0 | 4.2 | 4.9 | 4.0 | 1.8 | 1.0 | 0.7 | 0.4 | 4.4 | 1.6 | ||
| 2013 | 0.0 | 0.0 | 0.0 | 0.6 | 3.8 | 0.9 | 2.1 | 0.0 | 0.8 | 2.1 | 3.3 | 0.4 | 0.1 | 1.3 | 1.1 | 1.8 | 1.2 | ||
| 2012 | 1.2 | 1.6 | 0.2 | 2.2 | 3.3 | 0.3 | 0.0 | 0.0 | 2.4 | 3.6 | 3.7 | 2.4 | 1.8 | 2.0 | 0.1 | 3.2 | 1.7 | ||
| 2011 | 0.8 | 0.0 | 0.0 | 0.6 | 0.6 | 0.0 | 0.0 | 0.0 | 0.6 | 0.0 | 1.5 | 0.3 | 0.3 | 0.4 | 0.0 | 0.7 | 0.4 | ||
| 2010 | 0.0 | 0.0 | 0.0 | 0.0 | 0.5 | 0.0 | 0.0 | 0.0 | 0.4 | 0.0 | 1.0 | 0.0 | 0.0 | 0.1 | 0.0 | 0.3 | 0.1 | ||
| 2009 | 0.0 | 0.0 | 0.0 | 0.0 | 1.3 | 0.5 | 0.0 | 0.0 | 1.4 | 1.2 | 0.0 | 0.0 | 0.0 | 0.3 | 0.2 | 1.0 | 0.4 | ||
| 2008 | 0.0 | 0.0 | 0.0 | 0.7 | 1.3 | 0.5 | 0.0 | 0.0 | 1.6 | 1.6 | 0.9 | 0.0 | 0.0 | 0.6 | 0.2 | 1.5 | 0.6 | ||
| 2007 | 0.0 | 0.0 | 0.0 | 0.5 | 5.4 | 0.3 | 0.0 | 0.0 | 0.4 | 2.6 | 4.1 | 0.0 | 0.0 | 1.2 | 0.1 | 2.0 | 0.9 | ||
| 2006 | 0.0 | 0.0 | 0.0 | 0.3 | 0.0 | 0.0 | 0.0 | 0.0 | 0.6 | 2.2 | 1.4 | 0.4 | 0.2 | 0.1 | 0.0 | 1.2 | 0.4 | ||
| 2005 | 0.0 | 0.0 | 0.0 | 0.6 | 0.0 | 0.0 | 0.0 | 0.0 | 0.0 | 0.0 | 1.0 | 0.0 | 0.0 | 0.2 | 0.0 | 0.3 | 0.1 | ||
| 2004 | 0.0 | 0.0 | 0.0 | 0.6 | 0.6 | 0.5 | 0.0 | 0.0 | 1.0 | 1.6 | 0.0 | 0.0 | 0.0 | 0.4 | 0.2 | 1.0 | 0.4 | ||
| 2003 | 1.7 | 0.7 | 2.1 | 2.6 | 1.8 | 0.0 | 0.0 | 0.0 | 0.0 | 0.5 | 0.8 | 0.0 | 0.7 | 2.2 | 0.0 | 0.4 | 0.9 | ||
| 2002 | 0.0 | 0.0 | 0.0 | 3.0 | 0.0 | 1.2 | 0.6 | 0.0 | 0.9 | 1.2 | 1.2 | 0.5 | 0.2 | 1.1 | 0.8 | 1.1 | 0.8 | ||
| 2001 | 0.4 | 0.0 | 0.3 | 0.4 | 0.0 | 0.4 | 0.0 | 0.0 | 0.9 | 0.5 | 0.0 | 0.0 | 0.2 | 0.3 | 0.1 | 0.6 | 0.3 | ||
| 2000 | 0.0 | 0.0 | 0.0 | 0.0 | 0.0 | 0.3 | 0.0 | 0.5 | 0.4 | 0.4 | 2.7 | 0.0 | 0.0 | 0.0 | 0.3 | 0.9 | 0.3 | ||
| 1999 | 0.0 | 0.0 | 0.0 | 0.0 | 0.0 | 0.0 | 0.0 | 0.0 | 0.5 | 1.0 | 0.6 | 0.0 | 0.0 | 0.0 | 0.0 | 0.7 | 0.2 | ||
| 1998 | 0.0 | 0.0 | 0.0 | 2.2 | 2.7 | 0.0 | 0.0 | 0.0 | 1.1 | 2.6 | 0.0 | 0.0 | 0.0 | 1.5 | 0.0 | 1.3 | 0.8 | ||
| 1997 | 2.3 | 5.2 | 0.9 | 1.3 | 0.0 | 0.0 | 0.0 | 0.0 | 2.5 | 0.0 | 2.2 | 0.0 | 2.3 | 0.7 | 0.0 | 1.0 | 1.0 | ||
| 1996 | 0.0 | 0.0 | 1.3 | 0.0 | 0.9 | 0.0 | 1.0 | 0.0 | 2.9 | 3.1 | 0.0 | 0.0 | 0.0 | 0.7 | 0.3 | 2.2 | 0.8 | ||
| 1995 | 0.0 | 0.0 | 1.0 | 4.3 | 1.8 | 1.1 | 0.9 | 0.0 | 3.1 | 0.8 | 0.0 | 0.0 | 0.0 | 2.7 | 0.8 | 1.3 | 1.3 | ||
| 1994 | 3.9 | 0.0 | 0.0 | 2.3 | 1.5 | 2.2 | 0.0 | 0.0 | 1.1 | 3.8 | 2.5 | 3.4 | 2.3 | 1.4 | 0.6 | 2.7 | 1.8 | ||
| 1993 | 8.2 | 7.7 | 3.2 | 4.0 | 0.0 | 0.0 | 0.0 | 0.0 | 2.5 | 8.3 | 0.0 | 1.4 | 5.6 | 2.5 | 0.0 | 3.2 | 3.1 | ||
| 1992 | 7.7 | 11.1 | 22.4 | 7.4 | 4.2 | 3.2 | 1.7 | 0.0 | 2.8 | 1.7 | 1.3 | 13.3 | 10.6 | 11.6 | 1.9 | 1.9 | 6.9 | ||
| 1991 | 3.1 | 1.1 | 3.5 | 2.9 | 3.1 | 0.0 | 1.8 | 0.0 | 1.6 | 3.4 | 8.2 | 10.0 | 3.7 | 3.1 | 0.6 | 4.4 | 3.0 | ||
| 1990 | 1.3 | 1.1 | 3.2 | 3.1 | 0.9 | 4.2 | 1.4 | 1.4 | 2.3 | 4.8 | 1.4 | 2.6 | 1.4 | 2.3 | 2.3 | 2.9 | 2.1 | ||
| 1989 | 1.0 | 0.4 | 1.3 | 1.9 | 0.5 | 1.3 | 0.0 | 0.0 | 0.6 | 3.1 | 0.7 | 1.8 | 1.0 | 1.3 | 0.5 | 1.5 | 1.1 | ||
| 1988 | 2.2 | 1.9 | 0.0 | 0.8 | 1.0 | 0.5 | 0.5 | 0.6 | 2.0 | 8.0 | 1.5 | 1.4 | 1.8 | 0.7 | 0.5 | 3.7 | 1.7 | ||
| 1987 | 0.0 | 0.0 | 1.2 | 2.0 | 0.9 | 0.5 | 0.0 | 0.0 | 0.5 | 1.6 | 2.2 | 1.5 | 1.3 | 1.3 | 0.2 | 1.5 | 1.0 | ||
| 1986 | 0.0 | 0.0 | 0.0 | 0.0 | 0.0 | 0.0 | 0.0 | 0.0 | 0.0 | 5.9 | 0.0 | 0.0 | 0.0 | 0.0 | 0.0 | 2.7 | 0.7 | ||
| 1985 | 0.0 | 3.3 | 0.0 | 0.0 | 0.0 | 0.0 | 0.0 | 0.0 | 0.0 | 5.3 | 0.0 | 3.6 | 2.3 | 0.0 | 0.0 | 2.5 | 0.7 | ||
| 1984 | 0.0 | 10.0 | 0.0 | 8.3 | 0.0 | 0.0 | 0.0 | 0.0 | 0.0 | 2.9 | 0.0 | 2.9 | 4.1 | 4.8 | 0.0 | 1.1 | 1.7 | ||
| 1983 | 0.0 | 8.3 | 0.0 | 7.7 | 0.0 | 0.0 | 0.0 | 0.0 | 0.0 | - | 8.3 | 0.0 | 3.4 | 3.7 | 0.0 | 7.1 | 3.0 | ||
| 1982 | - | 0.0 | - | 0.0 | 12.5 | 7.1 | - | 0.0 | - | 23.1 | - | 7.1 | 4.0 | 11.1 | 4.0 | 23.1 | 8.3 | ||
Breeding data
Breeding records by month
Number of breeding records by breeding code and month, 2017 and all years| Breeding code | Jul | Aug | Sep | Oct | Nov | Dec | Jan | Feb | Mar | Apr | May | Jun |
|---|---|---|---|---|---|---|---|---|---|---|---|---|
| 2017 | ||||||||||||
| Breeding (BLA code) | 0 | 0 | 0 | 0 | 0 | 0 | 0 | 0 | 0 | 0 | 0 | 0 |
| Carrying Food | 0 | 0 | 0 | 0 | 0 | 0 | 0 | 0 | 0 | 0 | 0 | 0 |
| Copulating | 0 | 0 | 0 | 0 | 0 | 0 | 0 | 0 | 0 | 0 | 0 | 0 |
| Display | 0 | 0 | 0 | 0 | 0 | 0 | 0 | 0 | 0 | 0 | 0 | 0 |
| Dependent young | 0 | 0 | 0 | 0 | 0 | 0 | 0 | 0 | 0 | 0 | 0 | 0 |
| Faecal sac | 0 | 0 | 0 | 0 | 0 | 0 | 0 | 0 | 0 | 0 | 0 | 0 |
| Inspecting hollow | 0 | 0 | 0 | 0 | 0 | 0 | 0 | 0 | 0 | 0 | 0 | 0 |
| Nest building | 0 | 0 | 0 | 0 | 0 | 0 | 0 | 0 | 0 | 0 | 0 | 0 |
| Nest with eggs | 0 | 0 | 0 | 0 | 0 | 0 | 0 | 0 | 0 | 0 | 0 | 0 |
| Nest with young | 0 | 0 | 0 | 0 | 0 | 0 | 0 | 0 | 0 | 0 | 0 | 0 |
| On/leaving nest | 0 | 0 | 0 | 0 | 0 | 0 | 0 | 0 | 0 | 0 | 0 | 0 |
| All years | ||||||||||||
| Breeding (BLA code) | 0 | 0 | 0 | 0 | 0 | 0 | 0 | 0 | 0 | 0 | 0 | 0 |
| Carrying Food | 0 | 0 | 0 | 0 | 0 | 0 | 0 | 0 | 0 | 0 | 0 | 0 |
| Copulating | 0 | 0 | 0 | 0 | 0 | 0 | 0 | 0 | 0 | 0 | 0 | 0 |
| Display | 0 | 0 | 0 | 0 | 0 | 0 | 0 | 0 | 0 | 0 | 0 | 0 |
| Dependent young | 0 | 0 | 0 | 0 | 0 | 0 | 0 | 0 | 0 | 0 | 0 | 0 |
| Faecal sac | 0 | 0 | 0 | 0 | 0 | 0 | 0 | 0 | 0 | 0 | 0 | 0 |
| Inspecting hollow | 0 | 0 | 0 | 0 | 0 | 0 | 0 | 0 | 0 | 0 | 0 | 0 |
| Nest building | 0 | 0 | 0 | 0 | 0 | 0 | 0 | 0 | 0 | 0 | 0 | 0 |
| Nest with eggs | 0 | 0 | 0 | 0 | 0 | 0 | 0 | 0 | 0 | 0 | 0 | 0 |
| Nest with young | 0 | 0 | 0 | 0 | 0 | 0 | 0 | 0 | 0 | 0 | 0 | 0 |
| On/leaving nest | 0 | 0 | 0 | 0 | 0 | 0 | 0 | 0 | 0 | 0 | 0 | 0 |
Breeding records by year
Average number of breeding records per period by breeding code| Period | Breeding (BLA code) | Carrying Food | Copulating | Display | Dependent young | Faecal sac | Inspecting hollow | Nest building | Nest with eggs | Nest with young | On/leaving nest |
|---|---|---|---|---|---|---|---|---|---|---|---|
| All years | |||||||||||
| All | 0.0 | 0.0 | 0.0 | 0.0 | 0.0 | 0.0 | 0.0 | 0.0 | 0.0 | 0.0 | 0.0 |
| Previous years | |||||||||||
| All previous years | 0.0 | 0.0 | 0.0 | 0.0 | 0.0 | 0.0 | 0.0 | 0.0 | 0.0 | 0.0 | 0.0 |
| Previous 30 years | 0.0 | 0.0 | 0.0 | 0.0 | 0.0 | 0.0 | 0.0 | 0.0 | 0.0 | 0.0 | 0.0 |
| Previous 20 years | 0.0 | 0.0 | 0.0 | 0.0 | 0.0 | 0.0 | 0.0 | 0.0 | 0.0 | 0.0 | 0.0 |
| 10 year groups | |||||||||||
| [2007,2017) | 0.0 | 0.0 | 0.0 | 0.0 | 0.0 | 0.0 | 0.0 | 0.0 | 0.0 | 0.0 | 0.0 |
| [1997,2007) | 0.0 | 0.0 | 0.0 | 0.0 | 0.0 | 0.0 | 0.0 | 0.0 | 0.0 | 0.0 | 0.0 |
| [1987,1997) | 0.0 | 0.0 | 0.0 | 0.0 | 0.0 | 0.0 | 0.0 | 0.0 | 0.0 | 0.0 | 0.0 |
| 5 year groups | |||||||||||
| [2012,2017) | 0.0 | 0.0 | 0.0 | 0.0 | 0.0 | 0.0 | 0.0 | 0.0 | 0.0 | 0.0 | 0.0 |
| [2007,2012) | 0.0 | 0.0 | 0.0 | 0.0 | 0.0 | 0.0 | 0.0 | 0.0 | 0.0 | 0.0 | 0.0 |
| [2002,2007) | 0.0 | 0.0 | 0.0 | 0.0 | 0.0 | 0.0 | 0.0 | 0.0 | 0.0 | 0.0 | 0.0 |
| [1997,2002) | 0.0 | 0.0 | 0.0 | 0.0 | 0.0 | 0.0 | 0.0 | 0.0 | 0.0 | 0.0 | 0.0 |
| [1992,1997) | 0.0 | 0.0 | 0.0 | 0.0 | 0.0 | 0.0 | 0.0 | 0.0 | 0.0 | 0.0 | 0.0 |
| [1987,1992) | 0.0 | 0.0 | 0.0 | 0.0 | 0.0 | 0.0 | 0.0 | 0.0 | 0.0 | 0.0 | 0.0 |
| Year | |||||||||||
| 2017 | 0.0 | 0.0 | 0.0 | 0.0 | 0.0 | 0.0 | 0.0 | 0.0 | 0.0 | 0.0 | 0.0 |
| 2016 | 0.0 | 0.0 | 0.0 | 0.0 | 0.0 | 0.0 | 0.0 | 0.0 | 0.0 | 0.0 | 0.0 |
| 2015 | 0.0 | 0.0 | 0.0 | 0.0 | 0.0 | 0.0 | 0.0 | 0.0 | 0.0 | 0.0 | 0.0 |
| 2014 | 0.0 | 0.0 | 0.0 | 0.0 | 0.0 | 0.0 | 0.0 | 0.0 | 0.0 | 0.0 | 0.0 |
| 2013 | 0.0 | 0.0 | 0.0 | 0.0 | 0.0 | 0.0 | 0.0 | 0.0 | 0.0 | 0.0 | 0.0 |
| 2012 | 0.0 | 0.0 | 0.0 | 0.0 | 0.0 | 0.0 | 0.0 | 0.0 | 0.0 | 0.0 | 0.0 |
| 2011 | 0.0 | 0.0 | 0.0 | 0.0 | 0.0 | 0.0 | 0.0 | 0.0 | 0.0 | 0.0 | 0.0 |
| 2010 | 0.0 | 0.0 | 0.0 | 0.0 | 0.0 | 0.0 | 0.0 | 0.0 | 0.0 | 0.0 | 0.0 |
| 2009 | 0.0 | 0.0 | 0.0 | 0.0 | 0.0 | 0.0 | 0.0 | 0.0 | 0.0 | 0.0 | 0.0 |
| 2008 | 0.0 | 0.0 | 0.0 | 0.0 | 0.0 | 0.0 | 0.0 | 0.0 | 0.0 | 0.0 | 0.0 |
| 2007 | 0.0 | 0.0 | 0.0 | 0.0 | 0.0 | 0.0 | 0.0 | 0.0 | 0.0 | 0.0 | 0.0 |
| 2006 | 0.0 | 0.0 | 0.0 | 0.0 | 0.0 | 0.0 | 0.0 | 0.0 | 0.0 | 0.0 | 0.0 |
| 2005 | 0.0 | 0.0 | 0.0 | 0.0 | 0.0 | 0.0 | 0.0 | 0.0 | 0.0 | 0.0 | 0.0 |
| 2004 | 0.0 | 0.0 | 0.0 | 0.0 | 0.0 | 0.0 | 0.0 | 0.0 | 0.0 | 0.0 | 0.0 |
| 2003 | 0.0 | 0.0 | 0.0 | 0.0 | 0.0 | 0.0 | 0.0 | 0.0 | 0.0 | 0.0 | 0.0 |
| 2002 | 0.0 | 0.0 | 0.0 | 0.0 | 0.0 | 0.0 | 0.0 | 0.0 | 0.0 | 0.0 | 0.0 |
| 2001 | 0.0 | 0.0 | 0.0 | 0.0 | 0.0 | 0.0 | 0.0 | 0.0 | 0.0 | 0.0 | 0.0 |
| 2000 | 0.0 | 0.0 | 0.0 | 0.0 | 0.0 | 0.0 | 0.0 | 0.0 | 0.0 | 0.0 | 0.0 |
| 1999 | 0.0 | 0.0 | 0.0 | 0.0 | 0.0 | 0.0 | 0.0 | 0.0 | 0.0 | 0.0 | 0.0 |
| 1998 | 0.0 | 0.0 | 0.0 | 0.0 | 0.0 | 0.0 | 0.0 | 0.0 | 0.0 | 0.0 | 0.0 |
| 1997 | 0.0 | 0.0 | 0.0 | 0.0 | 0.0 | 0.0 | 0.0 | 0.0 | 0.0 | 0.0 | 0.0 |
| 1996 | 0.0 | 0.0 | 0.0 | 0.0 | 0.0 | 0.0 | 0.0 | 0.0 | 0.0 | 0.0 | 0.0 |
| 1995 | 0.0 | 0.0 | 0.0 | 0.0 | 0.0 | 0.0 | 0.0 | 0.0 | 0.0 | 0.0 | 0.0 |
| 1994 | 0.0 | 0.0 | 0.0 | 0.0 | 0.0 | 0.0 | 0.0 | 0.0 | 0.0 | 0.0 | 0.0 |
| 1993 | 0.0 | 0.0 | 0.0 | 0.0 | 0.0 | 0.0 | 0.0 | 0.0 | 0.0 | 0.0 | 0.0 |
| 1992 | 0.0 | 0.0 | 0.0 | 0.0 | 0.0 | 0.0 | 0.0 | 0.0 | 0.0 | 0.0 | 0.0 |
| 1991 | 0.0 | 0.0 | 0.0 | 0.0 | 0.0 | 0.0 | 0.0 | 0.0 | 0.0 | 0.0 | 0.0 |
| 1990 | 0.0 | 0.0 | 0.0 | 0.0 | 0.0 | 0.0 | 0.0 | 0.0 | 0.0 | 0.0 | 0.0 |
| 1989 | 0.0 | 0.0 | 0.0 | 0.0 | 0.0 | 0.0 | 0.0 | 0.0 | 0.0 | 0.0 | 0.0 |
| 1988 | 0.0 | 0.0 | 0.0 | 0.0 | 0.0 | 0.0 | 0.0 | 0.0 | 0.0 | 0.0 | 0.0 |
| 1987 | 0.0 | 0.0 | 0.0 | 0.0 | 0.0 | 0.0 | 0.0 | 0.0 | 0.0 | 0.0 | 0.0 |
| 1986 | 0.0 | 0.0 | 0.0 | 0.0 | 0.0 | 0.0 | 0.0 | 0.0 | 0.0 | 0.0 | 0.0 |
| 1985 | 0.0 | 0.0 | 0.0 | 0.0 | 0.0 | 0.0 | 0.0 | 0.0 | 0.0 | 0.0 | 0.0 |
| 1984 | 0.0 | 0.0 | 0.0 | 0.0 | 0.0 | 0.0 | 0.0 | 0.0 | 0.0 | 0.0 | 0.0 |
| 1983 | 0.0 | 0.0 | 0.0 | 0.0 | 0.0 | 0.0 | 0.0 | 0.0 | 0.0 | 0.0 | 0.0 |
| 1982 | 0.0 | 0.0 | 0.0 | 0.0 | 0.0 | 0.0 | 0.0 | 0.0 | 0.0 | 0.0 | 0.0 |
Distribution map
Distribution - 2017
This map shows the observed distribution of the Cattle Egret for 2017.
The red circles are the grid cells where Cattle Egret have been reported.
The transparency of the red circles indicate how many surveys sheets were submitted for that grid cell; the darker the red the more reliable the data. Of the 315 grid cells with reports, 83 had only one sheet; an example is grid number A11.
The size of the circle represents the reporting rate. The maximum reporting rate for Cattle Egret was 50.0% (eg grid number E10) and the minimum was 0.2% (eg grid number K16). 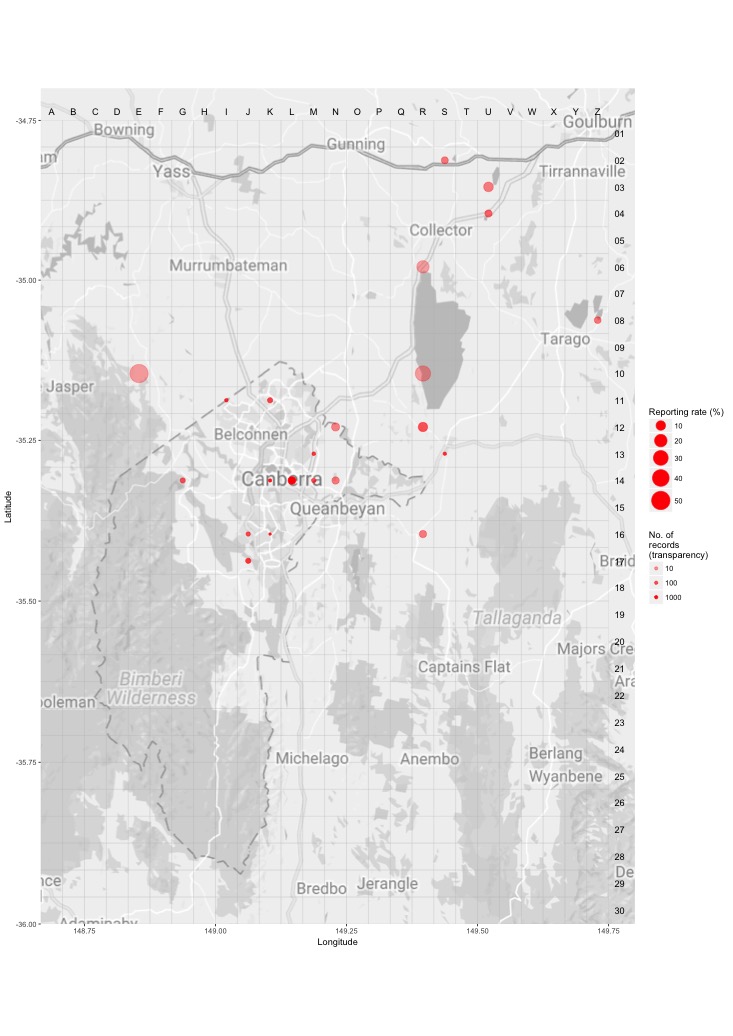
Distribution - all years
This map shows the observed distribution of the Cattle Egret for all years.
The red circles are the grid cells where Cattle Egret have been reported.
The transparency of the red circles indicate how many surveys sheets were submitted for that grid cell; the darker the red the more reliable the data. Of the 703 grid cells with reports, 55 had only one sheet; an example is grid number A12.
The size of the circle represents the reporting rate. The maximum reporting rate for Cattle Egret was 50.0% (eg grid number S9) and the minimum was 0.0% (eg grid number K13). 
Breeding map
Breeding - 2017
This map shows the breeding distribution of the Cattle Egret for 2017.
The red circles are the grid cells where breeding activity for Cattle Egret have been reported.
The size of the circle represents the number of reports. 
Breeding - all years
This map shows the breeding distribution of the Cattle Egret for all years.
The red circles are the grid cells where breeding activity for Cattle Egret have been reported.
The size of the circle represents the number of reports. 